
Peanuts Dancing in Beer
How the physics of bubbles inspired modestly interesting science

Now putting nuts in a pint of lager sounds like something that’d happen at a university rugby fresher initiation but stay with me, I’ll explain why peanuts oscillate up and down a glass of beer. It’s possibly my favourite of God’s Easter eggs and apparently an Argentinian pass-time?
Now, in June of this year the Royal Society thought it’d be funny to publish a paper on hoppy peanut oscillations in what was an undoubtedly a slow week for science. Once a peanut is immersed in the beer, it will sink a bit before making a resurgence, before sinking again and the cycle repeats for around two and a half hours before the peanut comes to rest. What a trip. See exhilerating demonstration below.
If you don’t particularly care for learning any new physics today then you’re welcome to turn your phone off and touch some much needed grass.
For the rest of you, I’m going to explain some bubble physics, by the end of the article I hope you like them as much as a young child or West Ham fan.
The Sinking
Now unsurprisingly, peanuts are more dense than beer, so we expect them to sink straight to the bottom of the glass. However, they don’t even make it to the bottom on the first go. The shelled peanuts act as a nucleation site for bubbles, which quickly attach themselves to the surface of the nut. This is more likely than bubbles attaching to the glass walls of the container due to the contact angle being much greater (Fig. 1). But why?
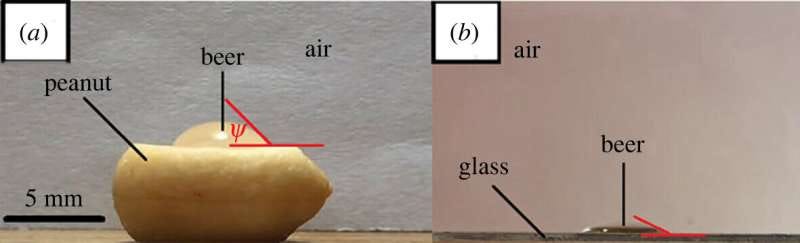
Figure 1: (a) a bubble attaching to the surface of a peanut where the contact angle (psi) is far greater than that of the glass wall surface as shown in (b).
This chance of nucleation as a function of contact angle can be justified with classical nucleation theory (CNT). The difference in an important thermodynamic function, the Gibbs free energy between the solid and gaseous phases characterises the affinity between the phases. The lower the difference in Gibbs free energy, the more likely a bubble will attach to the solid surface.
To simplify things, we’re only gonna focus on the two parameters just mentioned and how they scale with one another, but I’ll state the full equations before showing the relationship. Equation (1) defines the difference in Gibbs free energy.
which gives the simple proportionality,
So as a larger geometric parameter results in a larger difference in Gibbs free energy and vice versa. This geometric parameter α depends solely on the aforementioned contact angle ψ,
Now this relationship shows no direct proportionality between parameters so we can refer to Fig. 2 for help, where the black dashed line shows the relationship
Figure 2: The relationship between the geometric parameter α and the contact angle ψ where the average contact angles for glass walls and peanuts are shown in blue and yellow respectively. The inline image shows how CO₂ bubbles forms on the surface of two peanuts.
Now looking at the trend in Fig. 2 and remembering the direct proportionality shown in Eq. (2), we can see that the average contact angle for peanuts in comparison to glass results in a lower α and therefore a lower difference in Gibbs free energy and by extension, a greater affinity for bubbles to appear on the surface of the peanut when compared to the walls of a glass.
Rising Up
The buoyant force of the bubbles act in opposition to the sinking peanut, it reaches equilibrium before reaching the bottom of the glass and then reverses direction and floats to the top. This happens due to less dense than air bubbles binding to the nut to promote a greater buoyant thrust upwards, which eventually is greater than the downward pulling force on the nut (which is dependent on the size of the nut and the viscosity of the liquid it’s immersed in).
Bursting Bubbles
The bubbles attached themselves for the ride up but their demise is imminent. As they reach the surface of the beer they encounter a fluid less dense than itself for the first time in their sorry little lives, air. The surface tension acts to reduce the surface area to volume ratio, collapsing the bubbles from caps to spheres (the ideal shape for the minimum of this ratio) before the pressure is too great and the bubbles on the air facing side of the peanut pop, restarting the peanuts cycle down and up the beer again.
A Delicious Cycle
Now as said before, the dancing peanuts phenomenon is cyclic. Figure 3 shows a plot of vertical position of a peanut over 150 minutes, before the peanut comes to rest.
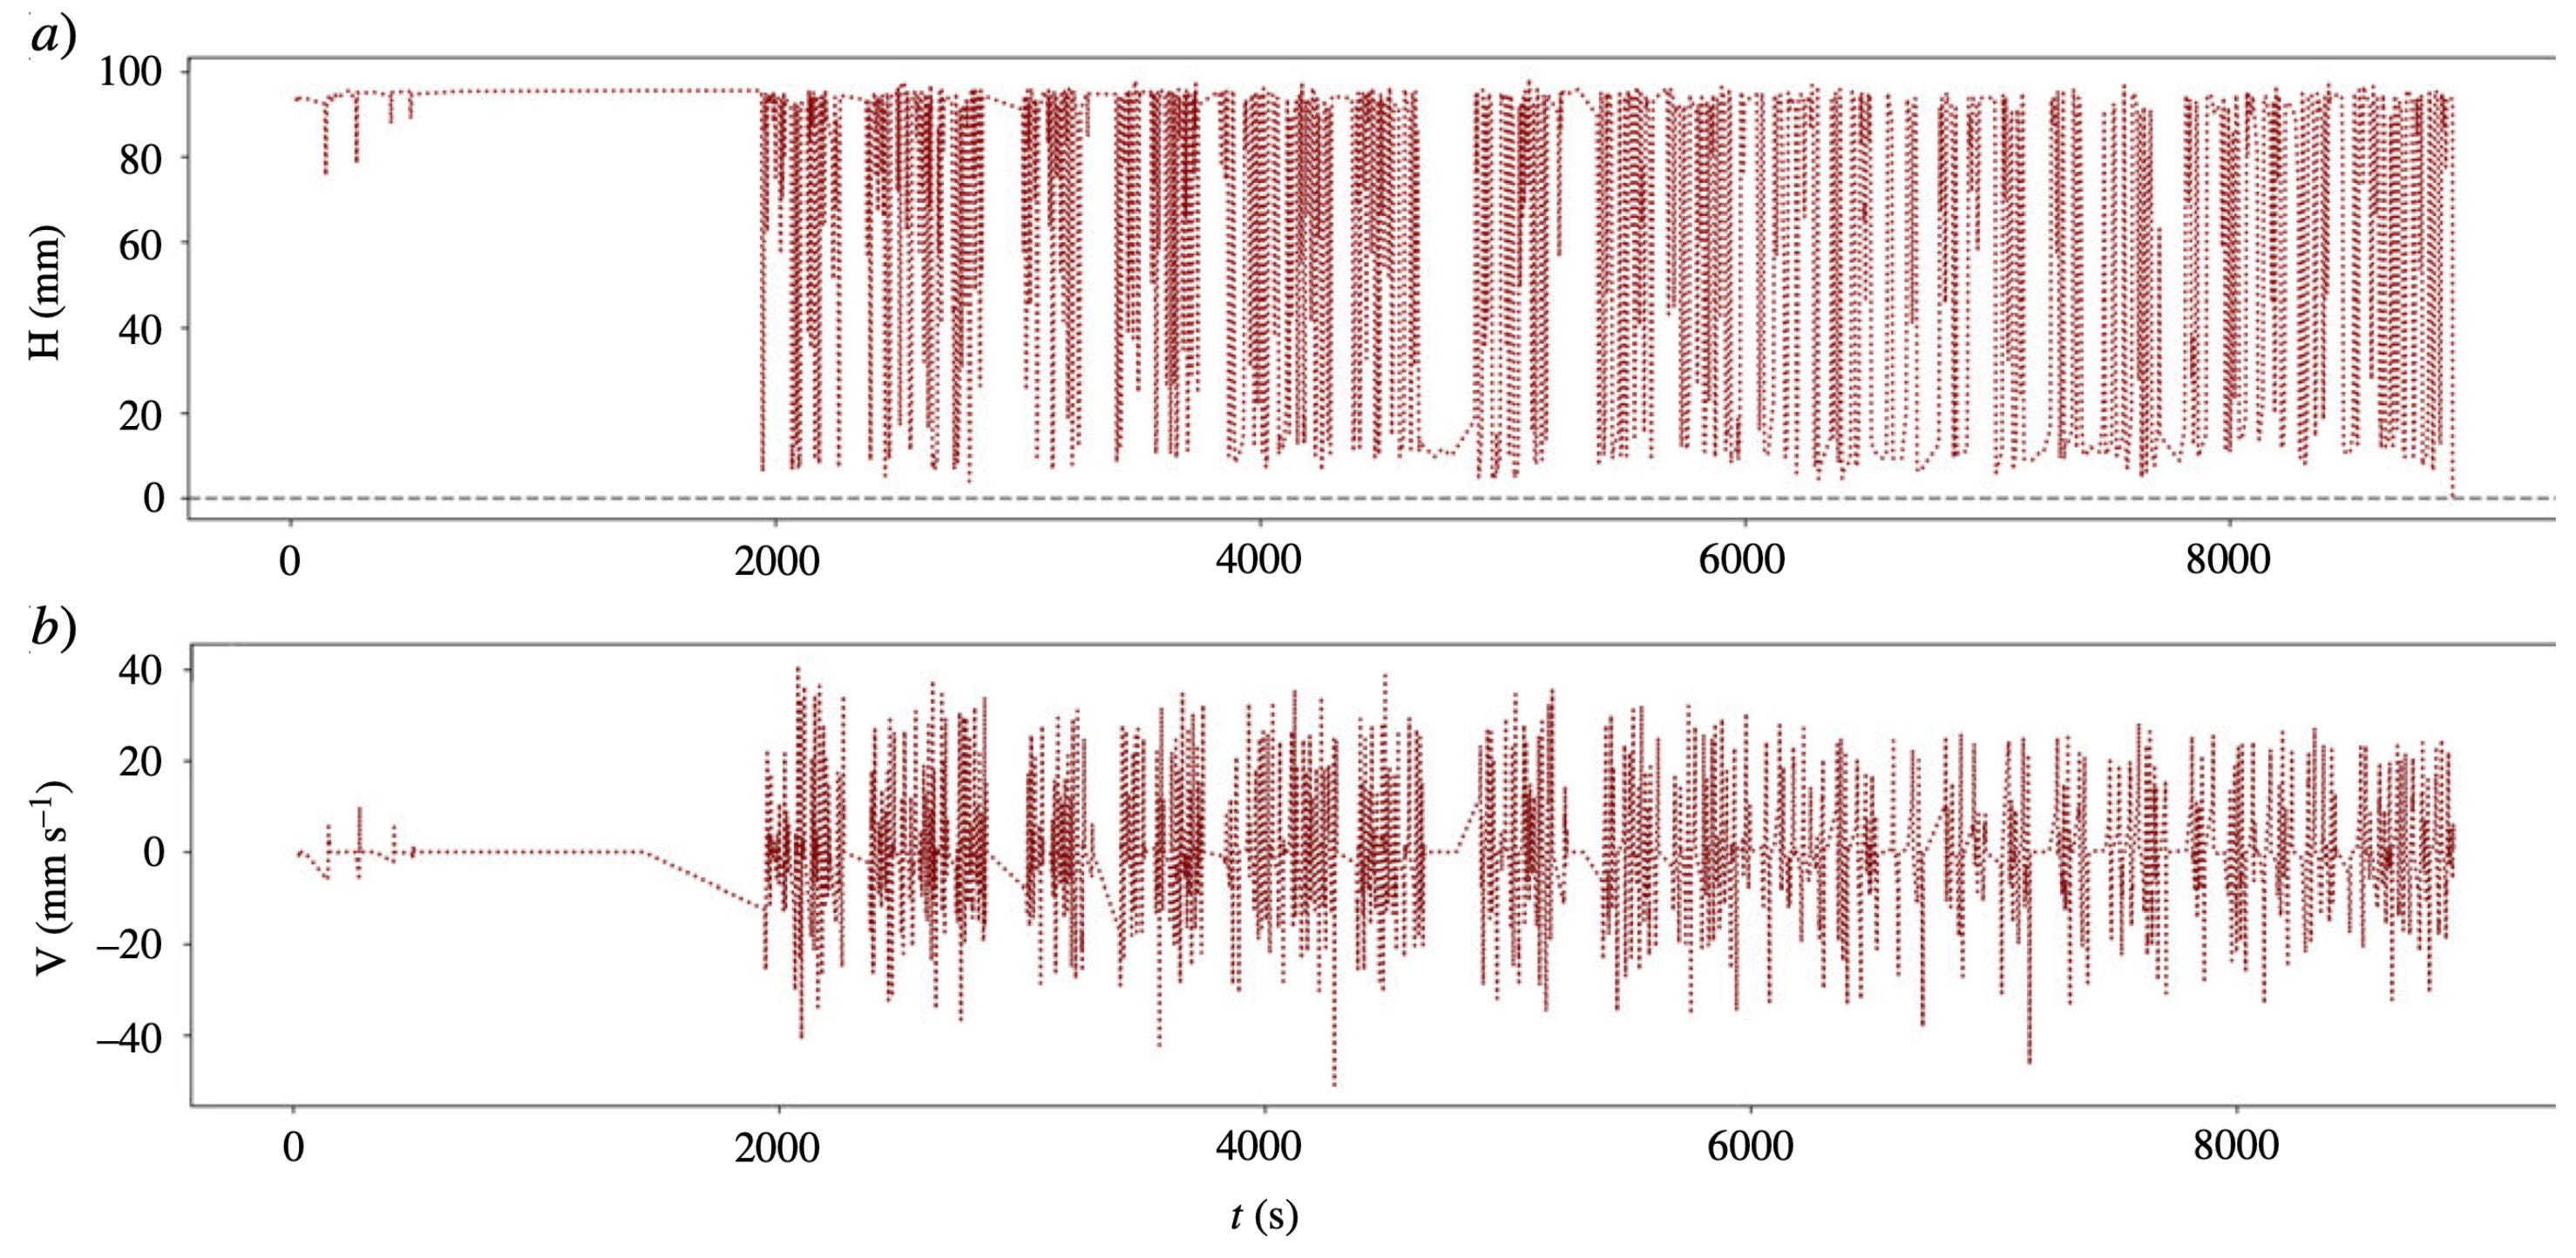
Figure 3: a) A plot of vertical position of a peanut H (mm) over time t (s). b) A plot of velocity V (mm/s) over time. Note that the total time amounts to around 150 minutes.
Is this Information Useful at all?
Unlike all funny bar tricks, this phenomenon might have some industrial use. It goes to show that curiosity is always rewarded. Some applications include:
Nuclear waste vitrification
Floatation process to separate Iron from ore
Geology - explaining why magnetite rises to higher layers in Earth’s crust than expected from its density.
References
(1) Pereira, Luiz, et al. "The physics of dancing peanuts in beer." Royal Society Open Science 10.6 (2023): 230376.
(2) https://phys.org/news/2023-06-scientists-peanuts-beer.html
Socials:
Instagram: mario.k.n
The website formerly known as twitter: marioknicola
Email: marioknicola@gmail.com
A song I’m listening to: